Key Features
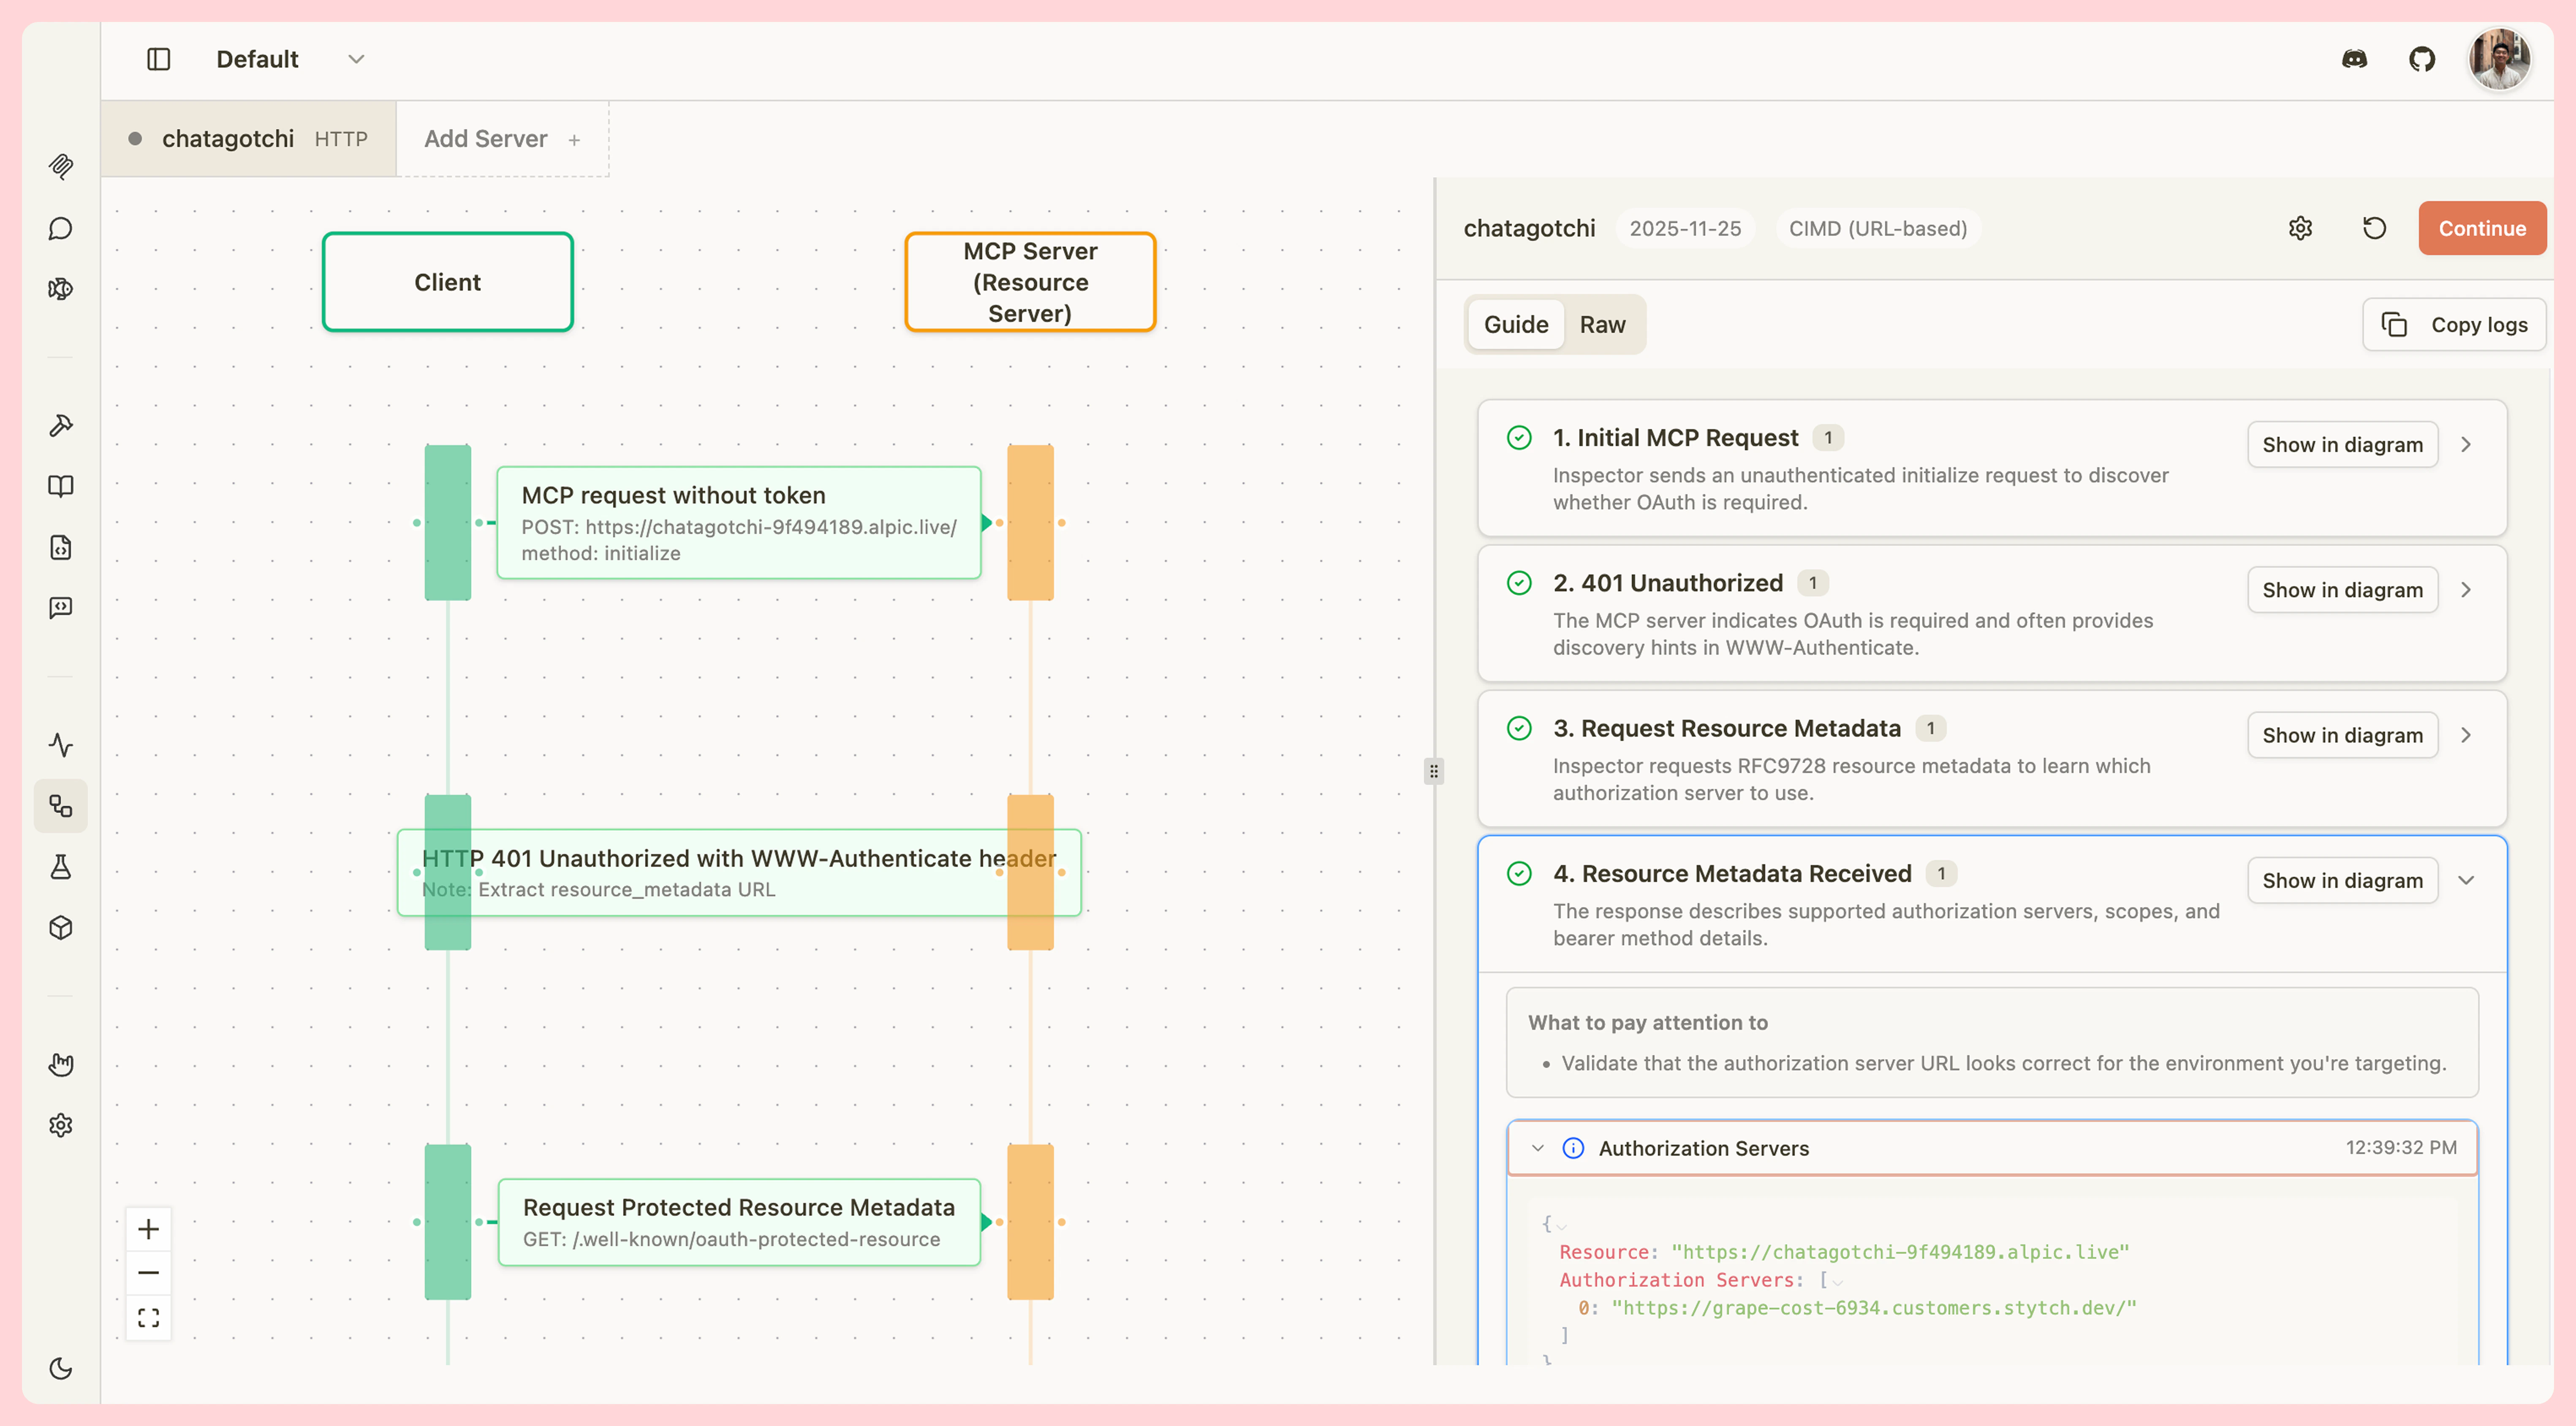
The OAuth Debugger provides comprehensive tooling for testing OAuth implementations:- Visual Step-by-Step Guide - Interactive flow guide with detailed explanations for each OAuth step
- Multi-Protocol Support - Test against OAuth spec versions 03-26, 06-18, and 11-25
- Full Registration Methods - Support for client pre-registration, Dynamic Client Registration (DCR), and Client ID Metadata Documents (CIMD)
- Network Inspection - View all HTTP requests and responses with headers and body content
- Educational Context - Built-in teachable moments and tips for common OAuth issues
- Sequence Diagram - Visual representation of the OAuth flow synchronized with your progress
- Export Capabilities - Copy logs in guide or raw format for debugging and documentation
Getting Started
To begin debugging OAuth flows:- Navigate to the OAuth Debugger - Click the OAuth Flow tab in MCPJam Inspector
- Configure a Target Server - Click Configure Target to open the OAuth Profile Modal
- Enter Server Details - Provide your server’s base URL and select your protocol version
- Choose Registration Method - Select CIMD, DCR, or pre-registered based on your implementation
- Start Testing - Click Continue to begin the OAuth flow
OAuth trace in server overview
When you connect a server using OAuth, Inspector records a structured trace of the entire flow. You can view this trace at any time — even after a failed connection — by opening the server’s detail panel and scrolling to the Last OAuth Trace section. The trace shows:- Source - Which part of the flow produced the trace (
interactive_connect,callback,refresh, orhosted_callback) - Current step - The step the flow reached before completing or failing
- Step-by-step breakdown - Each OAuth step with its status (
success,pending, orerror), a summary message, and optional HTTP request/response details - HTTP history - A bounded list of all HTTP calls made during the flow, with headers and bodies sanitized to redact sensitive values such as tokens and secrets
- Failure highlight - If a step failed, the error panel on the server card and the overview both identify the specific step that caused the failure